Asset Lifecycle
Feature: Asset Lifecycle
The Asset Lifecycle tool provides a centralized dashboard for all End-of-Life (EOL), End-of-Support (EOS), and End-of-Sale dates recorded in your Netbox instance. It enables proactive planning for hardware refreshes, support contract renewals, and budget forecasting.
Note: This feature relies on your Netbox instance having the custom fields end_of_life, end_of_support, and end_of_sale (as date types) assigned to objects like Device Types, Devices, or Platforms.
The tool is split into two main views: Report and Forecast.
The Report Tab
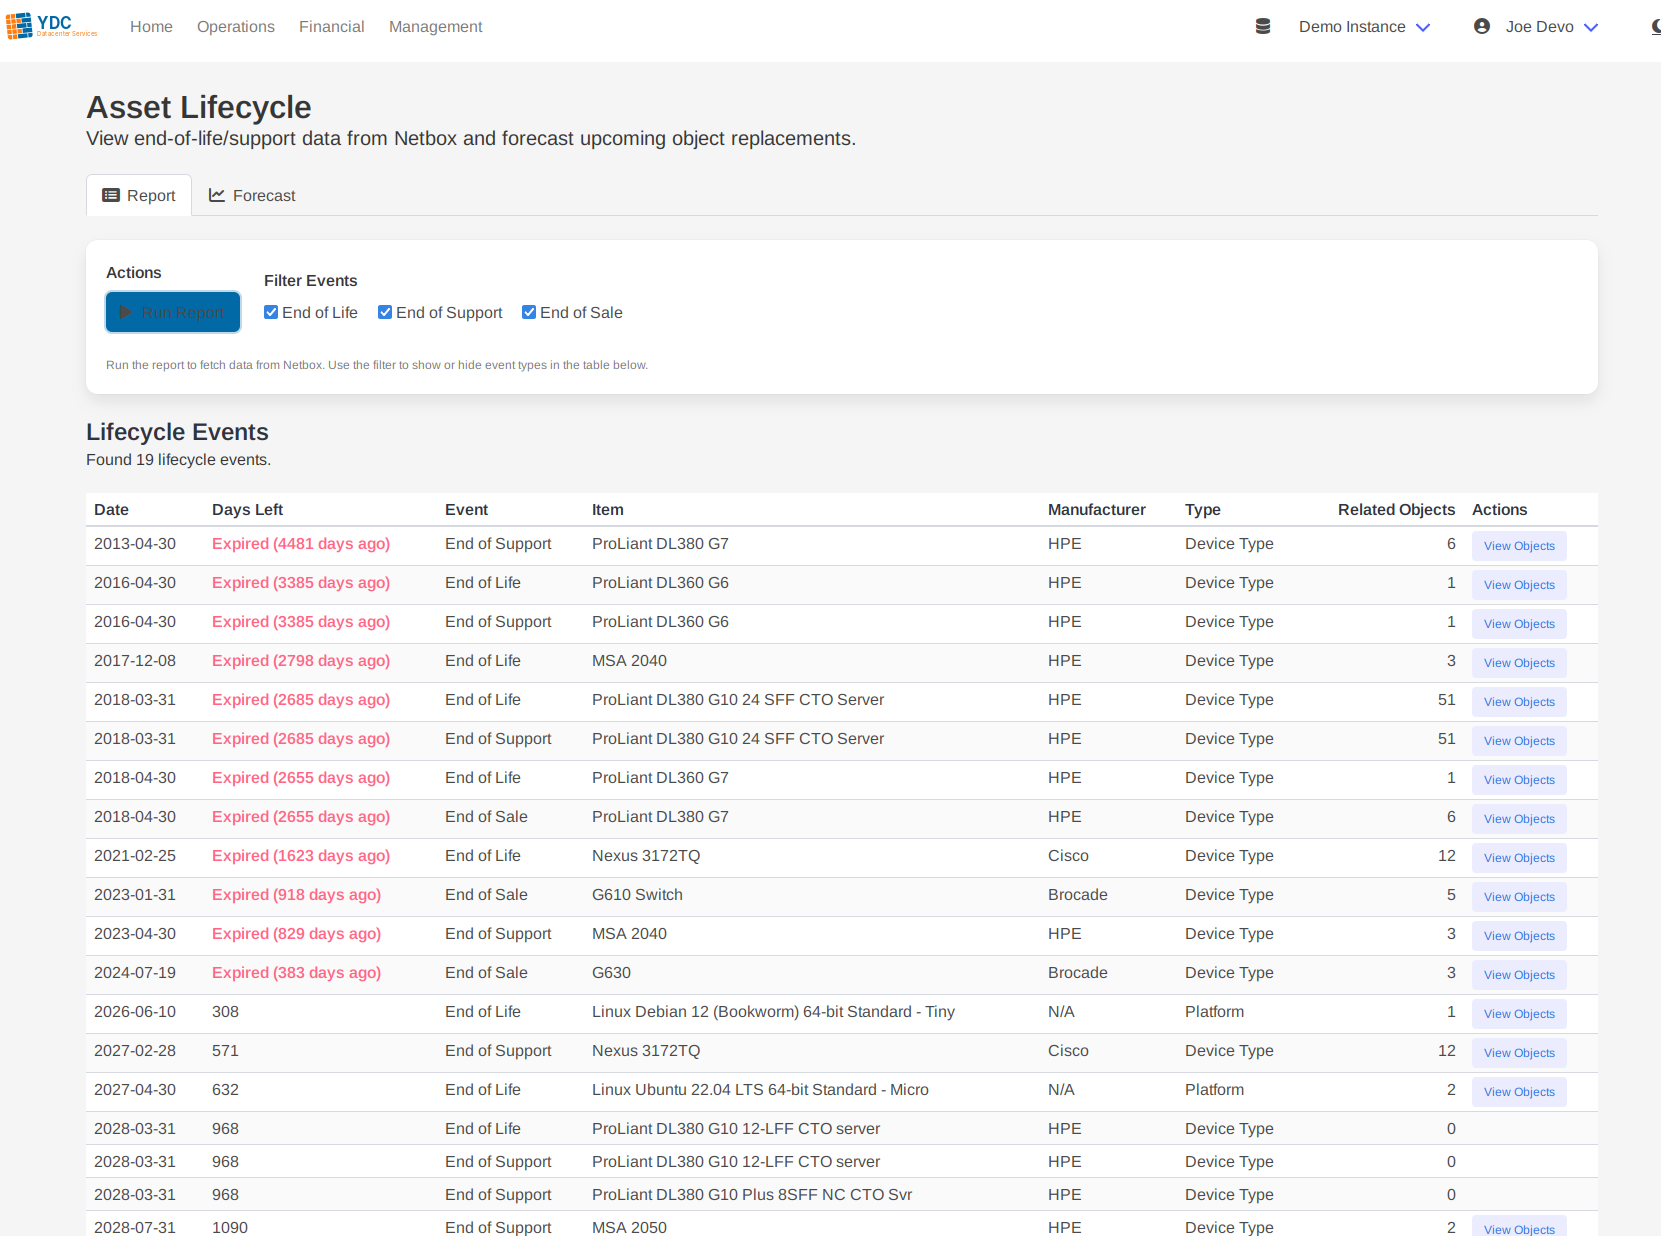
The Report tab is your primary view for all lifecycle events. It presents a comprehensive, sortable table of every object with a defined lifecycle date.
- Run Report: Click the Run Report button to fetch all relevant data from Netbox.
- Review Events: The table displays each event, showing the date, the number of days remaining, and the affected item. Events that are expired or expiring soon are highlighted for immediate attention.
- View Affected Objects: For items that represent a group (like a “Platform” or “Device Type”), the table shows a count of all related objects. Click the View Objects button to see a popup with a complete list of every device or VM affected by that specific lifecycle event.

The Forecast Tab
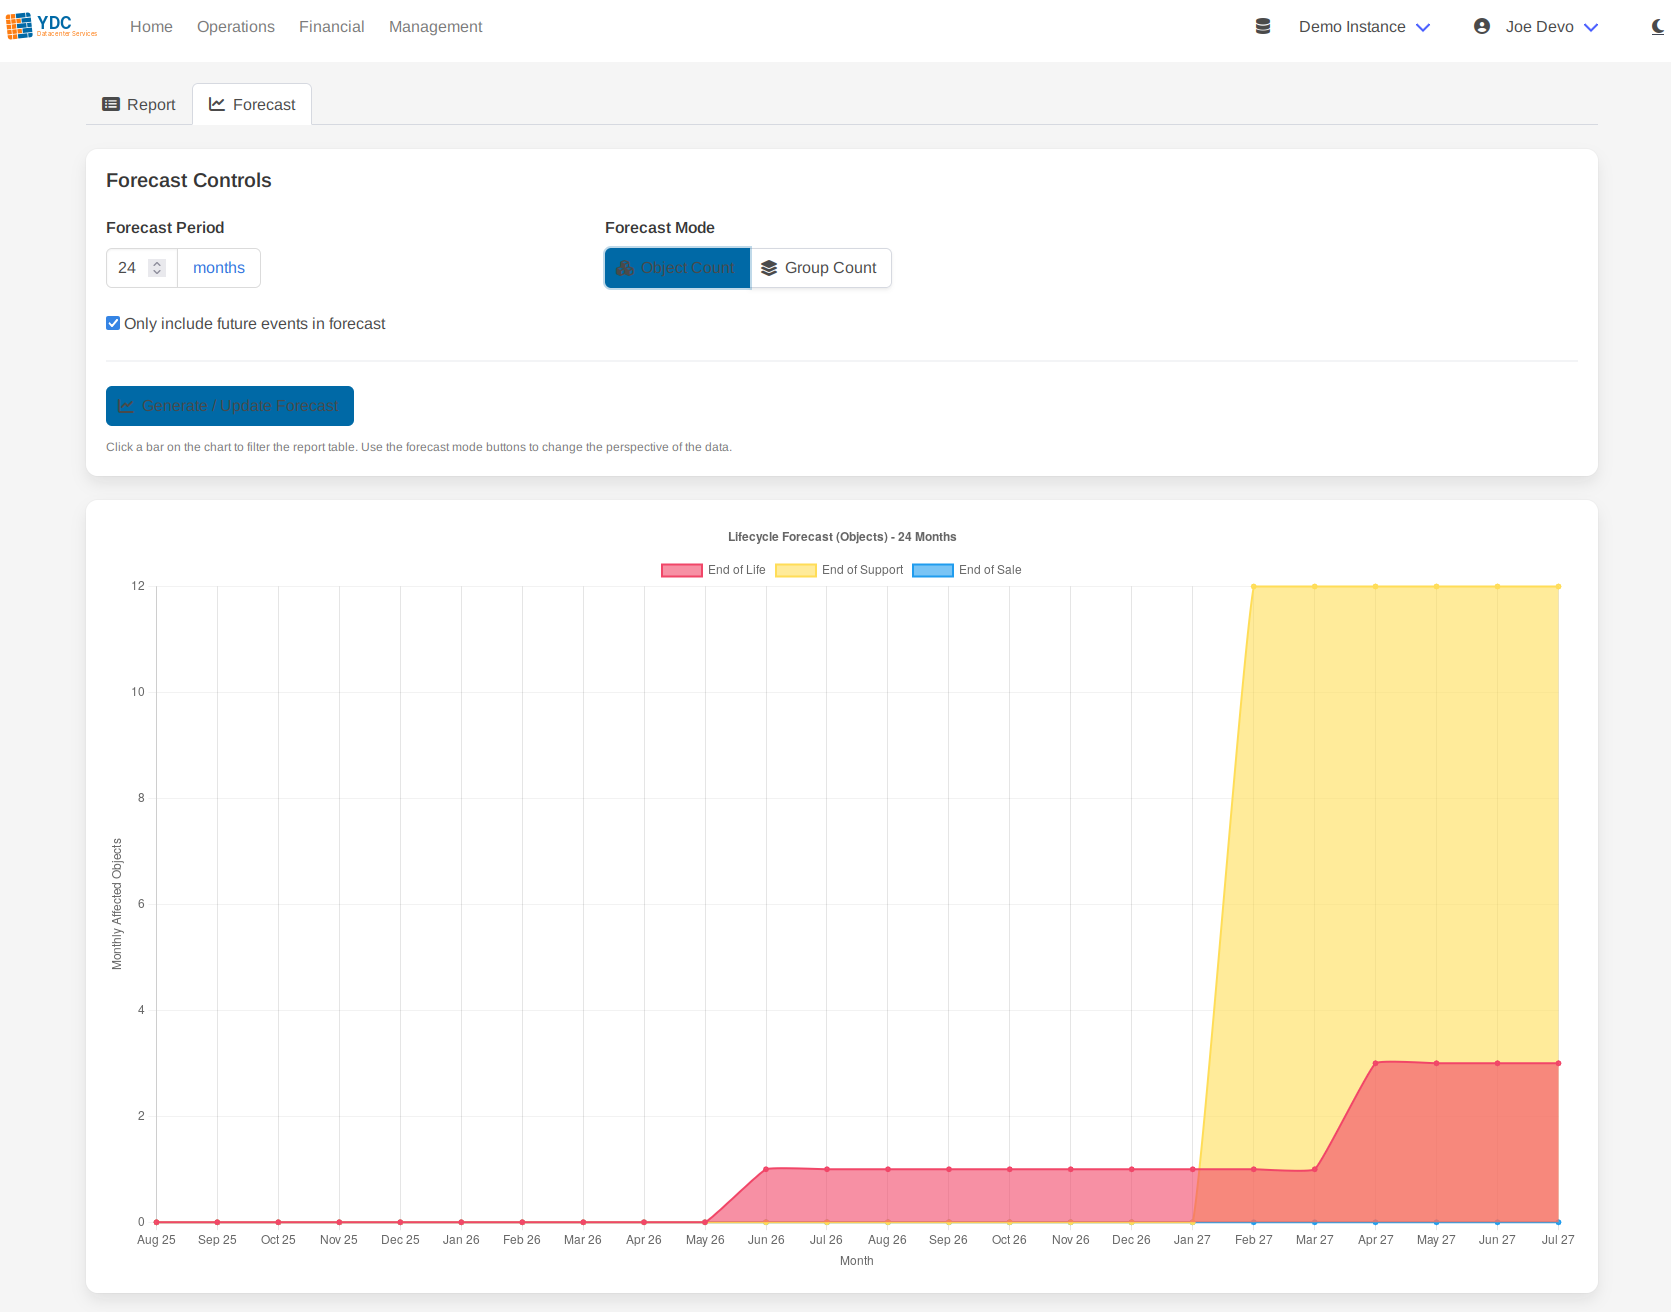
The Forecast tab provides a powerful visual chart to help you understand future lifecycle impacts over time.
- Generate Forecast: After running the report, switch to the Forecast tab. Adjust the forecast period (e.g., 24 months) and click Generate / Update Forecast.
- Interpret the Chart: A chart will appear, showing the cumulative number of items that will reach a lifecycle event each month. This makes it easy to spot upcoming periods that will require significant planning and budget.
- Switch Modes: You can change the perspective of the forecast:
- Object Count: Shows the total number of individual assets (e.g., 50 devices) affected each month. This is useful for understanding the raw scale of impact.
- Group Count: Shows the number of product lines (e.g., 2 device types) affected. This is useful for planning replacements for entire models or platforms.
