Site Dashboard
Feature: Site Dashboard
The Site Dashboard provides a high-level, aggregated view of a single site’s key infrastructure metrics. It consolidates data about space, power, connectivity, and assets into a single, easy-to-digest dashboard, making it ideal for capacity planning and operational oversight.
How to Use
-
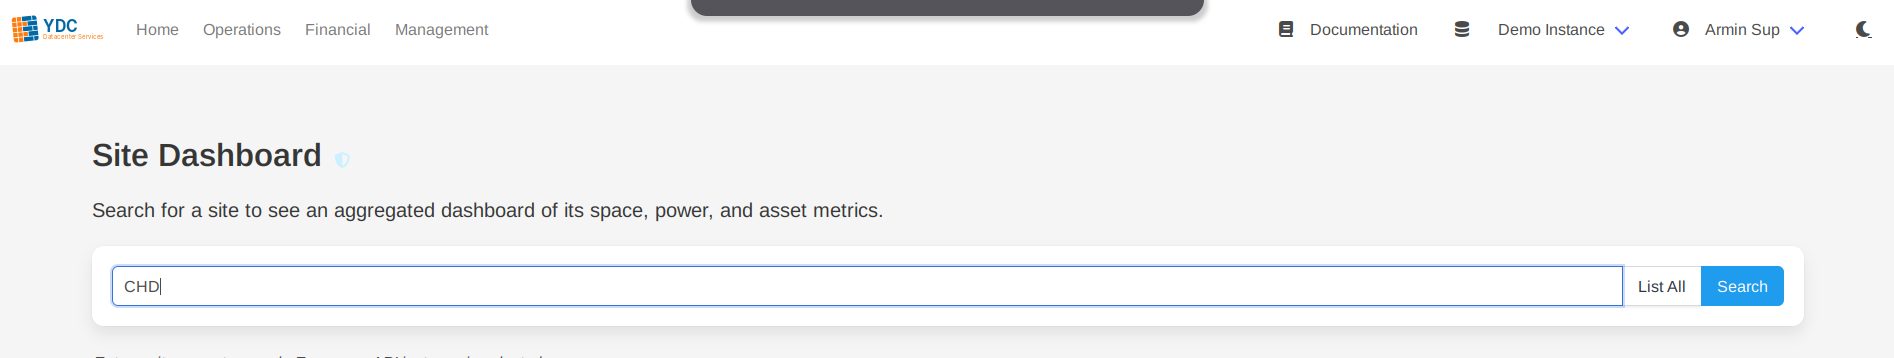
Search for a Site: Navigate to the “Site Dashboard” page and enter the name of the site you wish to view. The search is case-insensitive and supports partial matches.
-
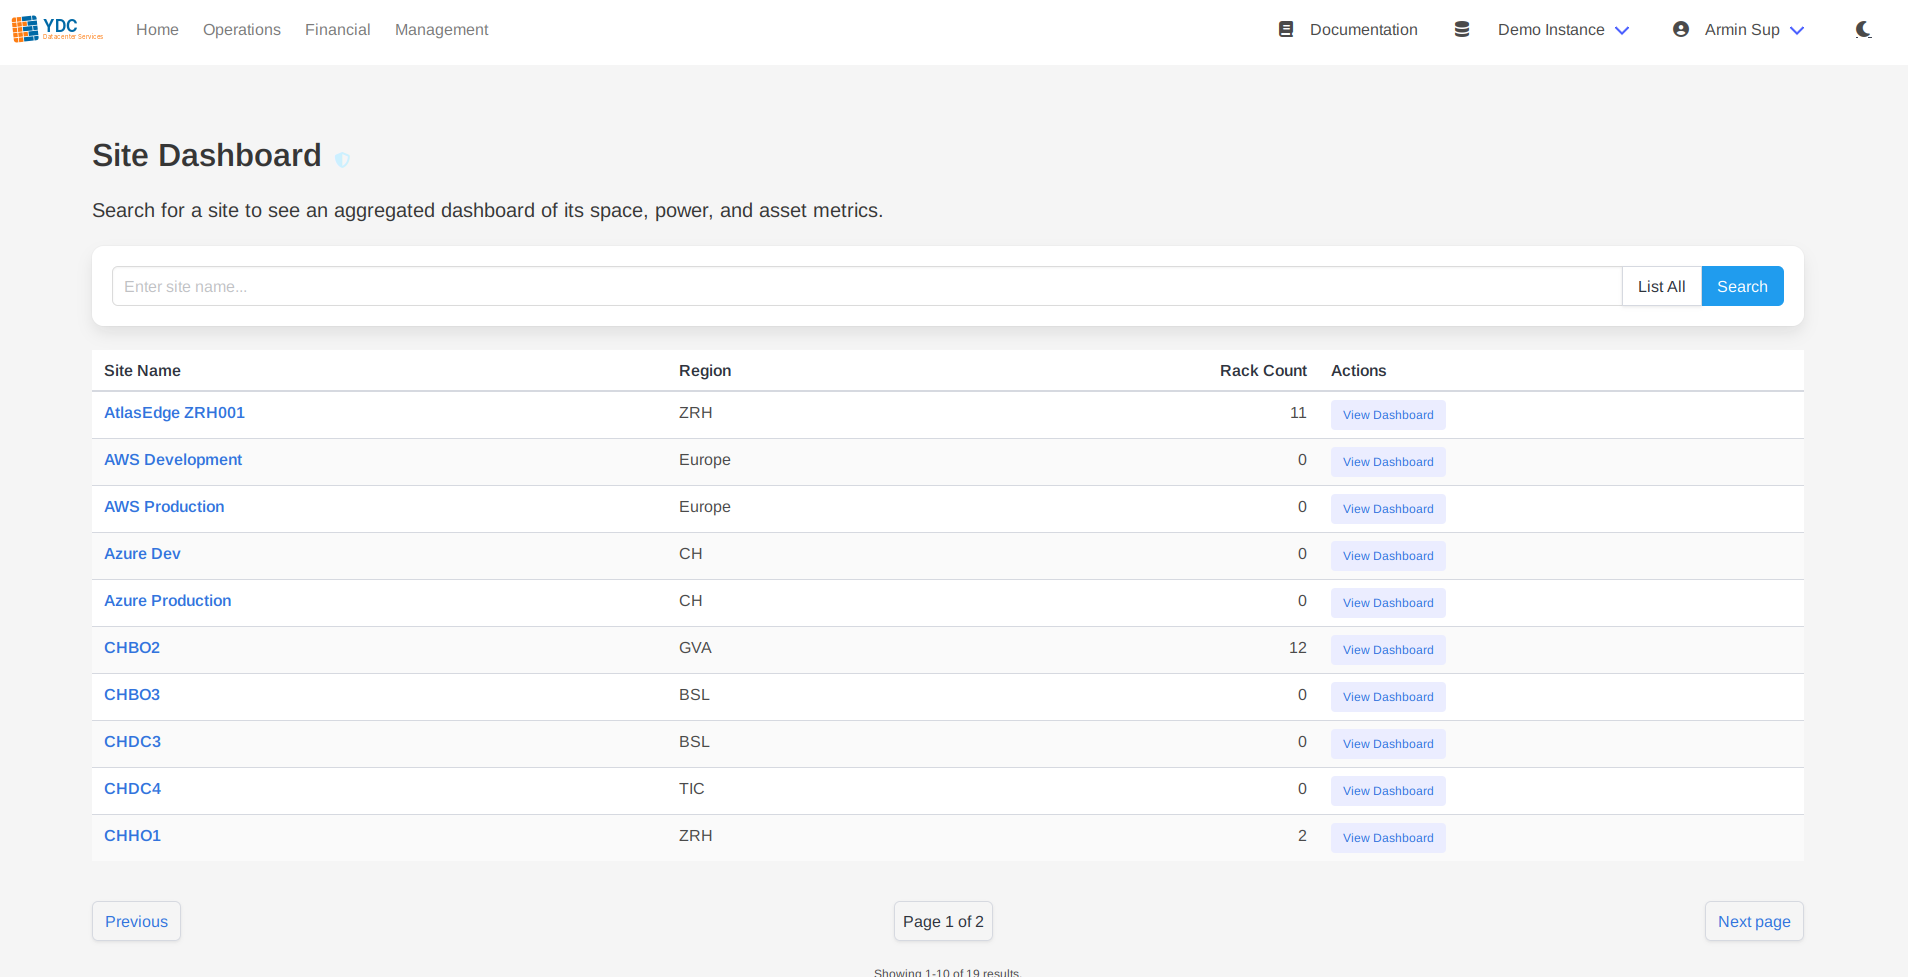
Select from Results: A table of matching sites will appear, showing the site name, region, and rack count. Click on a site’s name or the View Dashboard button to open its dashboard.
-
View the Dashboard: The dashboard will load, presenting all aggregated site information.
Understanding the Dashboard
The dashboard is organized into several key sections, providing a comprehensive overview at a glance.
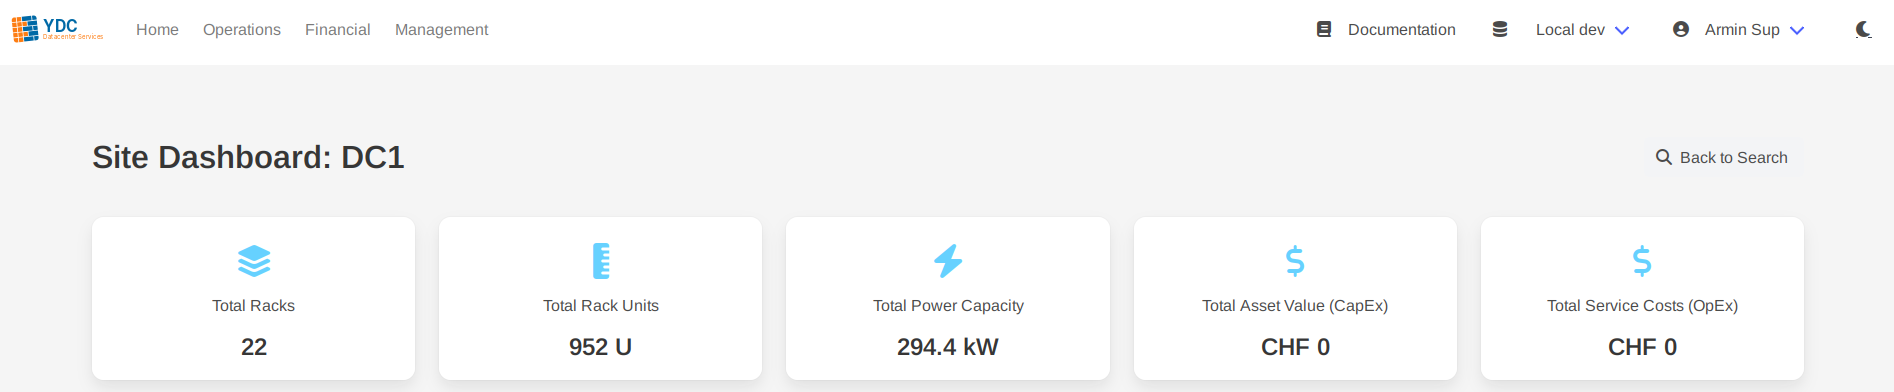
Key Performance Indicators (KPIs)
The top of the dashboard features a series of KPI cards that summarize the site’s most critical metrics:
- Total Racks: The total number of racks within the site.
- Total Rack Units: The combined rack unit capacity of all racks.
- Total Power Capacity: The total available power capacity in kW.
- Total Asset Value (CapEx): The aggregated capital expenditure value of all assets in the site.
- Total Service Costs (OpEx): The aggregated operational expenditure value of all services in the site.
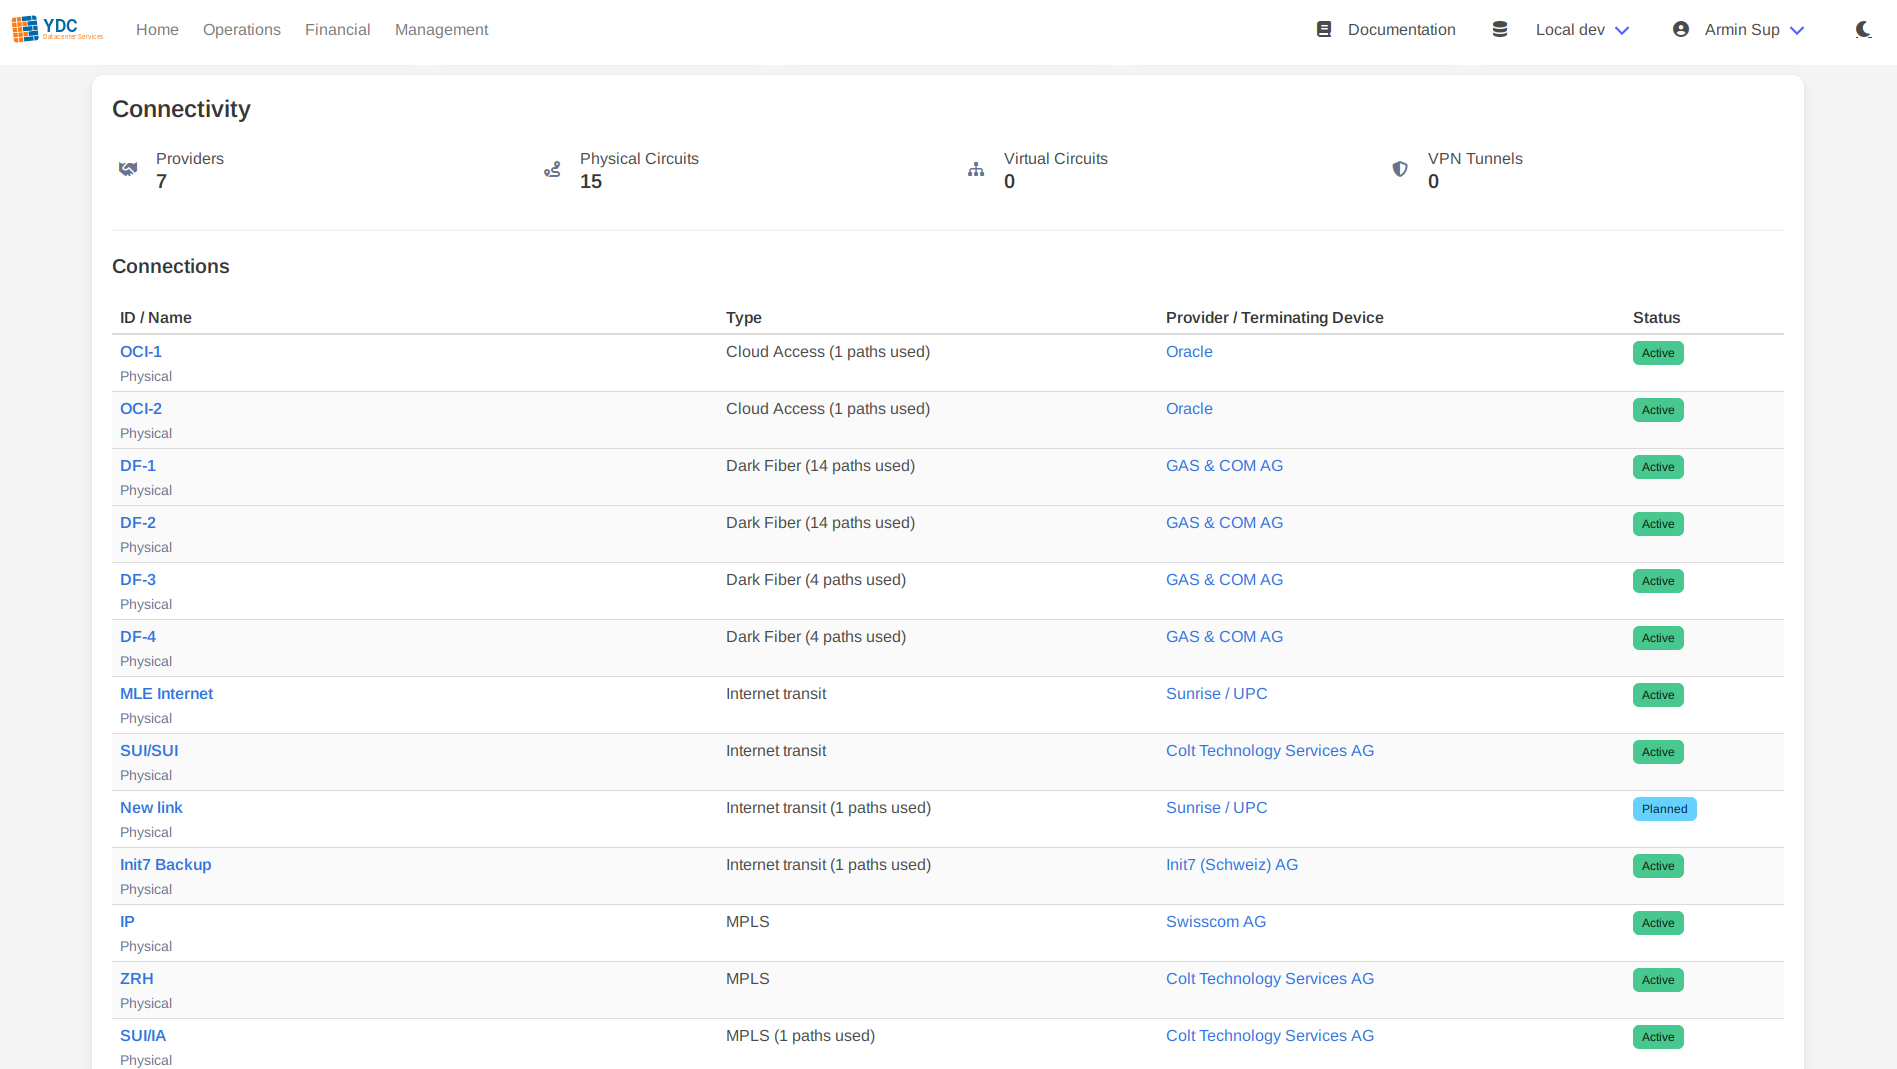
Connectivity
This section provides an overview of all network connections terminating at the site. It includes its own set of KPIs (Total Providers, Physical Circuits, Virtual Circuits, VPN Tunnels) and a detailed table listing every connection. The table shows the connection ID, type, provider, and status, with links to view each object directly in Netbox.
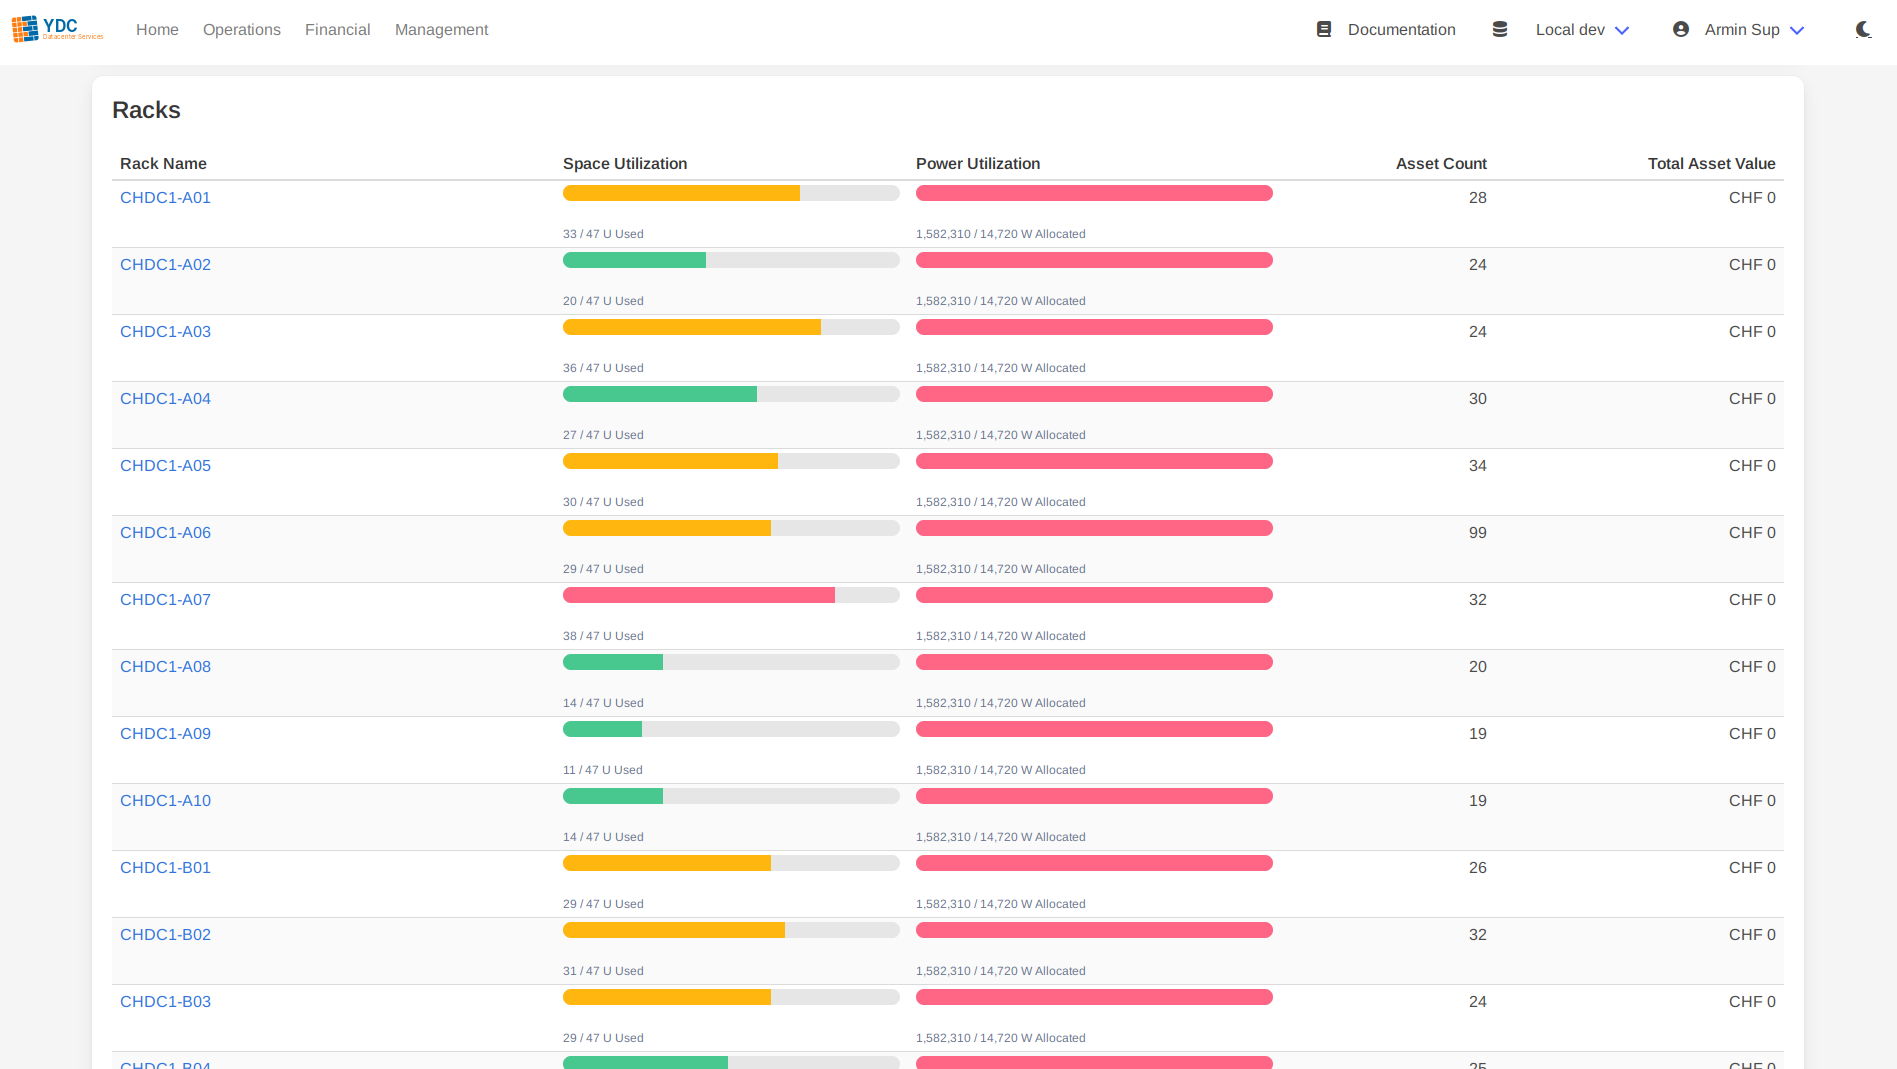
Racks
This section provides a detailed breakdown of every rack in the site. The table shows:
- Rack Name: The name of the rack, linked to its view in Netbox.
- Space Utilization: A progress bar visualizing the used vs. total rack units.
- Power Utilization: A progress bar visualizing the allocated vs. available power in watts.
- Asset Count: The number of devices installed in the rack.
- Total Asset Value: The summed value of all assets within that specific rack.